# Performance Overview Dashboard
The Manufacturing Performance Dashboard serves as an overview for monitoring and analyzing key performance metrics in real-time, providing a comprehensive overview of the manufacturing operations for a station or line.
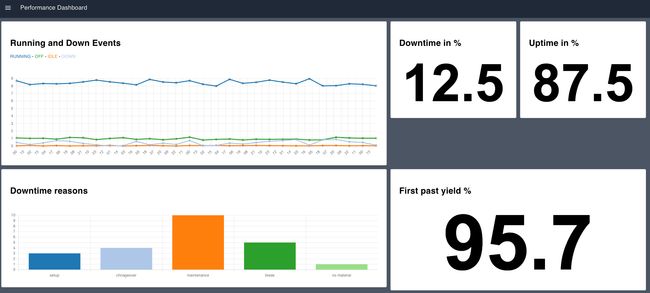
# Downtime in %
This section visualizes the percentage of downtime for the manufacturing station (or line).
# Uptime in %
Similar to the Downtime KPI, this section displays the percentage of uptime.
# First Past Yield %
The First Past Yield percentage is a measure of the quality and efficiency of the manufacturing process.
# Running and Down Events
This section provides a graphical representation of Running and Down events over time. The events are categorized as RUNNING, DOWN, IDLE, and OFF, each represented with a unique color on the chart.
# Downtime Reasons
This group provides insights into the reasons for downtime. It employs a bar chart to visualize different reasons for downtime, with each reason represented by a unique color.
# Start now
This blueprint is available during the creation of a FlowFuse instance.